What Is Dow Jones Industrial Average? The Basics Of Stock Market Indexes – For Dummies
Dow Jones Industrial Average (DJIA) is one of the most important stock market indexes today, not only in North America but in the whole world. It’s a reliable indicator of stock market sentiment and it is used by lots of analysts, traders, companies, and investors from all around the globe every single day, for all kinds of purposes. That’s why it’s really important for everyone interested in the stock market to understand what The Dow Jones Index actually is and how it works. Below is a very simple explanation of this:
What Is a Stock Market Index
In the beginning, there were only stocks in the markets. As you may know, stock prices constantly change, and because of the large number of different stocks, it is hard for people to track the performance of more than several stocks at once. This is how some smart guy invented stock market indexes. What they actually do is track the total performance of many stocks. This is their main purpose.
Example: Let’s say that we have only two stocks in the market:
Stock A trading at $5
Stock B trading at $20
If you want to track the price movements of both of them, you can create an index (let’s call it index AB) to do that. So, according to the prices of the example and if your index uses averaging, its value will be calculated by the following formula:
(Stock A price + Stock B price)
Index AB = ___________________________________
2
This is how your index will have a value of ($5 + $20) / 2 = 12.5
If the prices of the stocks change, the value of the index changes, too. This is how actually stock market indexes work. If Stock a goes to $7 and Stock B goes to $14, the value of the index AB will be ($7+$14)/2 = 10.5. The index tracks the total performance of all of its components (the items it follows).
The Dow Jones Industrial Average works the same way, it has 30 components, and it tracks the price movements of 30 of the biggest United States corporations. Here is some more specific information about the index:
The Dow 30 Index
Dow Jones is a major stock market index in the USA. Its full name is Dow Jones Industrial Average Index and it has been tracking the performance of the stock market for the last several hundred years. Other variants of its name are Dow 30, The Dow, Dow Jones Industrial, or just Dow Jones. Many people call it differently, but they all have in mind the index.
So, what a stock market index actually is? This is a virtual thing, an indicator, that has a price, which is derived from the prices of different things. The main purpose of indexes in finance is to track some changes in something. In our case, The Dow Jones Industrial Average Index tracks the share prices of the 30 biggest companies in the USA. This means that the value of the index is based on the share prices of all these 30 American companies, each of which has a different weight in the calculation of the index. This is how actually the value of the index changes – when the share price of the companies that it tracks changes. Each component of the index has a different weight on its value. This means that the prices of some stocks change the value of the index more than the prices of other stocks. The calculation of the index is more complex than that from the example above, but this doesn’t matter at all. The idea is the same. Dowjonestoday.online is a place with a lot of detailed information about the index. If you need more details, check it out.
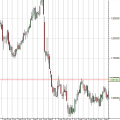
Live Chart
At the following link, you can see a live Dow Jones chart.
As you can see, the current level of the index constantly changes, because people trade the shares of its components and in this way, their price fluctuates.
The Dow Jones Index was calculated for the first time in 1896. It was invented by Charles Dow, who obviously used his name for the name of the index. He founded a company that maintains the index, called Dow Jones & Company which still exists today and is responsible for the calculation of the index value.
All of the 30 Dow Jones Companies/Components (Jan 2023)
The index tracks the price movements of all of these stocks. Sometimes one stock may leave the index and be replaced by another. These components change from time to time according to some rules:
| AXP | American Express Co |
| AMGN | Amgen Inc |
| AAPL | Apple Inc |
| BA | Boeing Co |
| CAT | Caterpillar Inc |
| CSCO | Cisco Systems Inc |
| CVX | Chevron Corp |
| GS | Goldman Sachs Group Inc |
| HD | Home Depot Inc |
| HON | Honeywell International Inc |
| IBM | International Business Machines Corp |
| INTC | Intel Corp |
| JNJ | Johnson & Johnson |
| KO | Coca-Cola Co |
| JPM | JPMorgan Chase & Co |
| MCD | McDonald’s Corp |
| MMM | 3M Co |
| MRK | Merck & Co Inc |
| MSFT | Microsoft Corp |
| NKE | Nike Inc |
| PG | Procter & Gamble Co |
| TRV | Travelers Companies Inc |
| UNH | UnitedHealth Group Inc |
| CRM | Salesforce Inc |
| VZ | Verizon Communications Inc |
| V | Visa Inc |
| WBA | Walgreens Boots Alliance Inc |
| WMT | Walmart Inc |
| DIS | Walt Disney Co |
| DOW | Dow Inc |
Stock Market Indexes
The stock market is an ever-changing collection of various stocks and other securities that can drastically shift in a matter of minutes. With all the moving parts, it can be hard to get an overall view of the stock market, which is why many financial analysts rely on stock market indexes.
A stock market index is a measurement of the value of a certain group of stocks. This can be done by tracking each individual stock and its individual performance, or by taking a broader look, and including the performance of multiple stocks and industries. Some indexes are focused on certain industries such as tech or energy, while others attempt to measure the overall performance of the stock market.
The most common index – Dow Jones Industrial Average, also known as the Dow – tracks 30 of the biggest publicly-traded companies in the US, and is one of the oldest stock market indexes with origins in the late 1800s. The S&P 500 is another popular index that tracks the performance of 500 different companies across different industries, which gives it more coverage than the majority of publicly-traded companies.
Some other indexes that focus more on particular industries include the NASDAQ, which is made up of thousands of stocks in the tech industry, and the Russell 3000, which covers the top 3000 stocks of various sectors and industries. Other indexes, such as the Wilshire 5000, track a broad range of industries and provide the best view of the market’s overall performance.
All these indexes come in handy for investors and analysts looking to get an idea of the current market performance. Different investors have different investment strategies, and by tracking the different indexes, they can get an idea if their strategy is having positive returns or if their portfolio is underperforming. It also helps them gauge potential risks and invest appropriately by tracking trends in the market.
The stock market indexes are essential for informed investment decisions, but they don’t always provide a perfect picture of the market. The indices only track stocks that have publicly available prices, which leaves out smaller stocks and privately held companies, and they can be easily skewed by big players in the market.
Still, the stock market indexes are a great tool for analyzing the stock market, and they are the first step to making informed investment decisions. Knowing how the major companies in the market are performing and how the market overall is changing can be invaluable. All in all, stock market indexes are an essential part of the investing landscape.
Check some other cool startup articles:
 How To Invest In The Dow Jones Industrial Average Index
 How Does The Stock Market Work – For Dummies
 What Is A Stock Market Crash? When Do Market Crashes Happen And How To Predict Them?
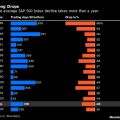 Duration Of The Bear Markets After The Biggest Stock Market Crashes In History
 7 Basic Tips To Help You Be A Better Investor And Make More Money From The Stock Market
 What Are Dow Jones Futures? How To Invest In Futures
What Is The Stock Market And How Does It Work? A Simple Definition for Beginners
Top 10 Stock Market Apps For Android
What Are Dow Jones Futures? How To Invest In Futures
What Is The Stock Market And How Does It Work? A Simple Definition for Beginners
Top 10 Stock Market Apps For Android